Data and evidence: The future
In this section, we have forecasted into the future using existing data trends.
“If we don’t dream about the future, it will happen to us in ways that we don’t want it to” - Russell Viner
We have taken the available data across our three core areas – global burden of disease, healthcare activity, and paediatric workforce – and used it to forecast trends out to 2040. By doing so, we hope to get a better understanding of what the future might look like, and how we can shape it for the better for paediatricians and ensure a healthier future for children and young people.
In this section we present data forecasts across these areas. More detailed information about what we did and our results is available in separately published work.
Paper 1 – Recent and forecast post-COVID trends in hospital activity in England amongst 0 to 24 year olds: analyses using routine hospital administrative data – view online
Paper 2 – Change in burden of disease in UK children and young people (0-24 years) over the past 20 years and estimation of potential burden in 2040: analysis using Global Burden of Disease (GBD) data – view online
Global burden of disease and disability
Total DALYs
We have used the data to forecast change in total DALYS from 2017 out to 2040.[1]
Models suggest continued falls in total DALYS in all age-groups, continuing trends seen across 1990 to 2017, although these changes are only significant amongst infants and 15-19 year old males, with smaller reductions seen in other age-groups, reflecting recent plateaus in DALYs.
DALYs by cause
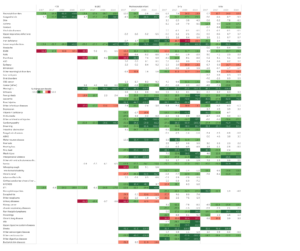
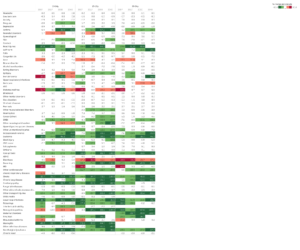
We also forecast percent change by cause for the decades to 2030 and 2040, and these are presented together with observed change for the decades to 2007 and 2017 for 0-9 year olds in Table 1 and 10-24 year olds in Table 2. Reductions are shown in green, with increases shown in red. Only major causes, i.e. those contributing 0.5% or more of total DALYS by age in 2017 are shown.
We observed the following trends:
- Forecasts for neonates predict continuation of major falls in neonatal and congenital causes and infectious diseases causes such as lower respiratory infections and meningitis over the next 20 years.
- Amongst infants after the neonatal period, forecasts predict the contribution of neonatal causes will remain largely stable with large reductions predicted in burden from congenital disorders, infectious causes (lower respiratory, meningitis), injuries, cardiovascular disorders and leukaemia.
- Amongst children 1-9 years, there are forecasts rises in burden due to neonatal disorders, epilepsy and other neurological conditions and chronic lung disorders, although most of these rises are relatively small. In contrast, forecasts predict large declines in historic causes of burden including congenital causes, various cancers, injuries, asthma, infections and cardiovascular causes.
- Amongst 10-24 year olds, forecasts predict that the large proportion of burden due to somatic symptoms, mental health problems and skin conditions will continue largely unchanged, with no conditions forecast to increase consistently across age-groups aside from diarrhoea. However, each older age-group is predicted to experience large falls in burden due to injuries including self-harm, various cancers and the majority of medical causes including asthma. These falls mean that the proportion of burden due to mental health problems and somatic symptoms will increase amongst 10-24 year olds over the next 20 years.
Healthcare activity
Based on the existing activity data for England (from 2007-2017), we have modelled some projections of future healthcare activity for England.[6] Unfortunately, we have not been able to do this for the other UK nations, but we think the projected trends will still be of relevance and interest. We looked at six scenarios.
Stable poverty projection, decreasing poverty projection, increasing poverty projection
We used short-term forecasts of a rise in child poverty from 29.5% in 2017 to 36.5% by 20215 to examine three future poverty scenarios including i) ‘stable poverty’, in which child poverty continues unchanged from 2017 to 2040 at 29.5%; ii) ‘decreasing poverty’, in which child poverty falls to 20% by 2021 and remain at this level to 2040; and iii) ‘increasing poverty’, in which child poverty rises to 36.5% by 2021 and remains at this high level to 2040.
COVID shock, integrated care-moderate and fully integrated care
We also estimated future scenarios in which health system reorganisation towards integrated care after the COVID-19 pandemic resulted in reductions in CYP ED attendances and emergency admissions due to ambulatory-care-sensitive-conditions (ACSC) being managed outside of hospitals. These scenarios began with the observed reduced activity during the pandemic from April to August 2020 in England (25% in emergency admissions and 50% in ED attendances and elective admissions; personal communication, Simon Kenny, NHS England).
These scenarios were estimated by calculating the impact of hypothesised reductions in activity due to ACSC on the stable poverty forecasts.
- First, the ‘COVID shock’ scenario hypothesised there was no significant reorganisation of healthcare and that activity returned to predicted levels in a linear fashion over 2020-2023.
- Second, two integrated care scenarios hypothesize that the reductions during the pandemic are maintained as health service change is implemented to maintain innovation and implement integrated care at scale. The ‘Fully integrated care’ scenario assumed that 100% of ACSC were managed outside the hospital system, and the ‘Moderate integrated care’ scenario assumed 50%. To calculate these we identified the proportion of emergency admissions that were ACSC for each age-group in 2017 and assumed this proportion remained constant to 2040.
The ‘increasing poverty’ scenario obviated the need for a separate scenario for increased poverty and disruption in the social determinants of health post-COVID. We did not estimate COVID impacts upon OPD attendances due to lack of information on drivers of increased activity and impacts of COVID-19.
Results
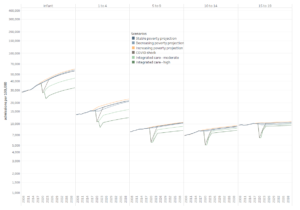
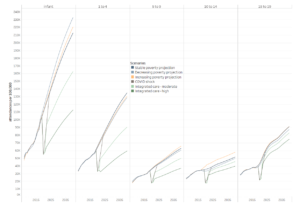
Projections of future CYP healthcare activity from 2018 to 2040 in scenarios of stable, increasing and decreasing poverty are shown in Figure 10 for total admissions and Figure 11 for ED attendances. More detail on the data is available in the Appendix files in our full research paper.[6]
In the stable poverty scenario, total admissions were forecast to increase by 2040 by 58% in infants, 39% in 1-4, 21% in 5-9, 17% in 10-14 and 4% in 15-19 year olds, with ED attendances similarly increasing by 144%, 143%, 107%, 49% and 140% respectively. In the decreasing poverty scenarios, forecast admission rates were lower by 2 to 5% than for stable poverty in total admissions and ED attendances in all age groups except amongst infants, where 99%CI overlapped markedly with stable poverty scenarios. Similarly in the increasing poverty scenarios, total admission rates and ED attendances were 3-5.5% higher than in the stable poverty scenarios except in infants where 99% CI overlapped markedly.
Post-COVID scenarios are also shown in Figures 10 and 11. The temporary COVID shock scenario had no impact upon forecast long-term activity. The impact of moderate or high levels of health system integration post-COVID appears highest amongst those under 10 years. Amongst infants, the moderate integration scenario reduced estimated activity in 2040 by 21.2-25.9% for admissions and 23.5-30.1% for ED attendances across poverty scenarios, whilst the high integration scenario decreased activity 42.4-45.8% and 47.0-51.6% respectively. Reductions of a similar order were seen for 1-9 year olds, whilst reductions amongst 10-19 year olds were considerably smaller.
We also look in our paper at paediatric outpatient attendances projections to 2040 in different poverty scenarios. We haven’t replicated this work here and encourage those interested to visit the full paper.[6]
Paediatric workforce
As before, it is important to note that this data should not be viewed in isolation from the healthcare activity data trends we have presented. Pressures and rota gaps in the paediatric workforce look set to continue, given projected future activity, particularly with regard to community care.
We’ve used a range of data about the paediatric workforce, primarily collected via the RCPCH Workforce Census, to forecast trends into the future. The forecast graphs were created by predicting a value based on the existing data along a linear trend. The future values are predicted using linear regression.
Data note: the census collects detailed data on consultant and SAS doctors in paediatrics, and data about trainees is collected by the GMC, therefore we based our models on these groups. It is a limitation that we don’t have such detailed data on other child health workforce groups and therefore cannot make projections.
Consultant and SAS doctor workforce projections
Figure 12 forecasts SAS doctor WTE into the future. The current rate of decline in this workforce group means we are projecting that there could be no more SAS doctors in paediatrics as soon as 2030. However, we may see a resurgence in numbers with the possible introduction of a new senior SAS grade contract.[2]
The decline in SAS doctors is nonetheless very concerning, as they are a key member of the child health team: there is an average of one on every middle grade rota they are relied upon in community paediatrics.[3]
Data note: the adjustment for whole-time-equivalent (WTE) has been achieved by assuming less than full time (LTFT) work 0.7 WTE across the board. This is an assumption based on reporting across a number of census years. In our individual workforce census reports, we have calculated WTE in more detail.
Figure 13 forecasts consultant WTE into the future. This needs to be viewed in the context of or forecasted healthcare activity. To put it into context: at present, the we have estimated that demand for paediatric consultants in the UK is around 21% higher than 2017 workforce levels, and an additional 642 whole time equivalent (WTE) consultant paediatricians are needed to meet demand in England.[4] At the same time emergency admissions are rising, and numbers of hospital beds for children in England fell 16.4% from 5315 in 2007/08 to 4441 in 2016/17, further illustrating increasing strain on the system. This strain is set to continue, and we expect demand to continue to outrun workforce supply into the future.
In an earlier section, we also reported on consultant working patterns. We have chosen not to forecast this specifically as the trend has been stable since 2003, and we expect it to continue.
Figure 14 shows the forecast proportion of generalist paediatricians to 2040, which is expected to experience only a small increase based on current trends.
Alongside Figure 14 (above), we have forecast the proportion of community paediatric consultants to 2040. This paints a very concerning picture, with community consultants set to make up just over 10% of the paediatric consultant workforce in 2040. Future models of care are discussed elsewhere in our work, but particular focus will need to be given to ensuring there is a workforce to meet the growing shift towards taking a whole population approach to care.
Trainee workforce projections
Figure 16 forecasts paediatric trainee headcount into the future. This is a slow increase, which is largely explained by the fact that paediatric training places in England are currently fixed at 350 per year. If this number remains, paediatrics is at risk of serious future workforce gaps, given that RCPCH estimate that there is a need to recruit approximately 600 doctors into ST1 training posts each year for approximately the next 5 years.[5]
Figure 17 shows the forecast rise in less than full time working among paediatric trainees to levels of around 50-70%. This is concerning, as although Figure 16 (above) shows that trainee numbers are slowly increasing, LTFT working is rapidly increasing. This may result in greater shortfall and be “invisible” to workforce planners who don’t take LTFT/WTE into account.
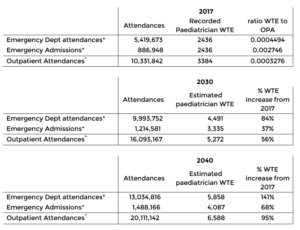
Consultant WTE and healthcare activity
We have also used data from our 2017 workforce census[5] to calculate ratios of WTE paediatricians in England to total healthcare activity in England (emergency attendance, admissions and outpatients). We have then used these ratios to calculate how many WTE paediatricians we might need to service the modelled increased in attendances for 2030 and 2040, using the data from our projected healthcare activity models.
These calculations demonstrate that increases of 70-140% increases will be needed to meet healthcare demand and need in 2040. The assumption that the 2017 ratio will continue to 2040 is of course an assumption – however we don’t have any other data to base an assumption on. The purpose of this is to illustrate a potential scenario rather than say what is definitely going to happen.
Data notes:
- All data was from 2017 (RCPCH workforce and healthcare activity)
- We included both consultants and non-consultant grades (excluding trainees)
- Less than full time was accounted for as 0.7 WTE on average
Notes
*The number of paediatricians undertaking emergency activity is calculated as the sum of all general/acute paediatricians and 50% of community and specialist paediatricians
^The number of total paediatricians in 2017 is used as the denominator for OPA as all paediatricians undertake outpatient activities.
References
Ward J, Hargreaves D, Turner S, Viner R, Royal College of Paediatrics and Child Health Paediatrics 2040 Data Working Group. Change in burden of disease in UK children and young people (0-24 years) over the past 20 years and estimation of potential burden in 2040: analysis using Global Burden of Disease (GBD) data. medRxiv 2021.02.20.21252130; doi [Appendix Figure 2]
BMA. SAS contract negotiations [webpage] https://www.bma.org.uk/pay-and-contracts/contracts/sas-doctor-contract/sas-contract-negotiations
RCPCH. Workforce census: Focus on SAS doctors (2019). https://www.rcpch.ac.uk/resources/workforce-census-focus-sas-doctors-2019
RCPCH. Shortage of consultant paediatricians in the UK (2019). https://www.rcpch.ac.uk/resources/shortage-consultant-paediatricians-report
RCPCH. 2017 workforce census overview (2019). https://www.rcpch.ac.uk/sites/default/files/2019-11/soch_workforce_census_overview_2019_-_v4_30.10.19.pdf
Ward J, Hargreaves D, Rogers M, Firth A, Turner S, Viner R. Recent and forecast post-COVID trends in hospital activity in England amongst 0 to 24 year olds: analyses using routine hospital administrative data.