Data and evidence: Context
Here we look at what we know from existing data, focusing on four datasets: global burden of disease; healthcare activity; paediatric workforce; and voice of children and young people.
Our work on data and evidence has focused on two broad areas, 1) the main problems impairing the health and wellbeing of our children and young people, and 2) the numbers of paediatricians we have in the UK to manage these issues.
We have access to two main types of data on health problems for children and young people.
The first are data on the burden of disease and disability. These include deaths and attempts to estimate the burden of morbidity and disability in children and young people. The second are data on healthcare activity by children, meaning the numbers of presentations to emergency departments, outpatient attendances and hospital admissions made by children. There are also data on presentations to primary care however they are not part of this project.
These two types of data tell us different things. Burden data give us a broader picture and include information on conditions that rarely present to hospital. Healthcare activity data tell us more directly about the impact that child health problems have for the work of paediatricians. Together both types of data contribute to understanding the problems children suffer from and the way that health services are used by children and families.
In this section we present existing data trends across these areas. More detailed information about what we did and our results is available in separately published work.
Paper 1 – Recent and forecast post-COVID trends in hospital activity in England amongst 0 to 24 year olds: analyses using routine hospital administrative data – view online
Paper 2 – Change in burden of disease in UK children and young people (0-24 years) over the past 20 years and estimation of potential burden in 2040: analysis using Global Burden of Disease (GBD) data – view online
Global burden of disease and disability
The past two decades have witnessed major changes in the lives of children and young people (CYP) and major increases in use of health services, particularly emergency services. There have also been a number of broader changes in patterns of disease in these age-groups. The reduction in burden from infectious diseases seen since the 1950s has been accelerated by the introduction of a range of new vaccines. However marked improvements in survival of extremely premature babies has resulted in increases in neurodisability amongst survivors, the there have been shifts in the numbers of CYP diagnosed with autism and learning difficulties, and the prevalence of mental health problems in the general population has risen considerably.
We used data from the Global Burden of Disease (GBD) study to identify recent and current burden of disease from various causes amongst children and young people. The GBD study, run from the Institute of Health Metrics and Evaluation (IHME, Seattle) produces high quality estimates of ill health and injury for each country, with detailed estimates available for each UK country.[1] GBD estimates of burden of disease are the most authoritative global estimates and are routinely used to inform healthcare policy by the World Health Organisation (WHO), other UN agencies and most national governments. In the UK GBD estimates have been used by Public Health England, Public Health Wales, the Chief Medical Officer and the National Institute for Health Research (NIHR).
The GBD study is a standardised analytical approach for estimating a) mortality; and b) key measures of health burden i.e. years of life lost due to premature mortality (YLLs) and years lived with disability (YLDs); the latter two of which sum to provide c) disability-adjusted life-years (DALYs). DALYs are the sum of YLLs and YLDs for each country, age group, sex, and year. DALYS provide an overall estimate of the burden related to a cause, i.e. they are an integrative measure of morbidity and mortality and reflect the contribution of each to overall burden of disease. For this reason, these analyses will use DALYs as the measure of burden of disease.
Analysis was undertaken in 3 sequential steps, 1) outlining current burden by age, 2) identifying change at cause level over the last two decades (1998-2007; 2008-2017) by age, and 3) forecasting burden by cause and age, sex to 2030 and 2040. Analyses presented here are for the UK as a whole.
Our full methods can be found in our published paper – what we have presented here is an executive summary.
Neonatal causes (diseases of prematurity) and congenital disorders dwarfed all other causes of DALYS across 0-24 year olds, with the largest causes otherwise being anxiety and depression, endocrine and immune disorders, and lower respiratory tract infections.
We studied the proportion of current (2017) burden of disease attributed to each cause by age, and observed the following findings:
- Amongst infants, together 80% of burden is attributable to neonatal causes and congenital disorders, with lower proportions due to SIDS and lower respiratory tract infections, endocrine disorders.
- For 1-4 year olds, whilst neonatal and congenital causes continue to be responsible for 12.3% and 10.8% respectively, the largest cause was skin problems (22.5%), with other major causes being wheeze/asthma, common infections, unintentional injuries and diarrhoea, although cancer and long-term conditions (asthma, epilepsy) begin to emerge as causes.
- Causes for 5-9 year olds were similar to 1-4 year olds with skin still the largest cause of DALYS, although proportions due to neonatal and congenital disorders are lower than younger children and asthma, nutrition, neurodevelopmental problems and mental health issues emerge as substantial causes.
- By 10-14 years, mental health problems emerge as the largest cause of burden in both sexes (22.4% in males; 25.2% in females) with major other causes being skin, injuries, somatic symptoms (headache, pain) and long-term conditions.
- The predominance of mental health causes was also evident in 15-19 year olds (22.4% of males; 24.6%) and 20-24 year olds (18.5% males; 20.1% females), with the other largest causes being substance use, somatic symptoms and injuries.
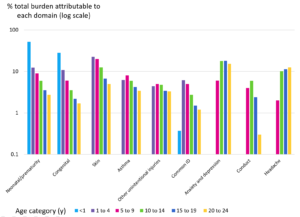
The following two figures summarise the burden of disease in 2017 for children aged 0-9 years and males and females separately for ages 10-24. These figures include domains of conditions which at any age contribute >10% of the total burden. The nine domains presented include >80% of the sum GBD for infants, >60% for 1-14 year olds, and for older males >35% and for older females >45%. For males and female >14 years pain and substance abuse were increasing contributors to GBD and for females gynaecological symptoms contributed to GBD.
Figure 1: Common causes of burden of disease for all children 0-9 and males only (10-24) in 2017
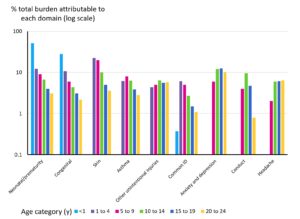
Figure 2: Common causes of burden of disease for all children 0-9 and females only (10-24) in 2017
Current (2017) burden of disease by age amongst 0-24 year olds has been presented in our research paper in ‘treemaps’; a treemap represents visually the proportion of burden attributable to each grouped cause, as well as showing the actual number of DALYs attributable to each cause, totalling 100%. Here, we have provided a copy of the treemap for age 1-4. The full treemaps for every age are available in our research paper.[2]
Figure 3: Treemap chart of proportions of total DALYs/100 000 population amongst 1-4 year olds for 2017. Note: causes in the treemap total to 100%
The level 3 GBD categorisation we used for causes does not align highly with work currently undertaken by paediatricians. Whilst we recategorized some causes to improve this alignment, other areas of work undertaken by paediatricians (e.g. child protection work; many aspects of community paediatrics) are not well represented in the cause hierarchy.
We also looked at percent change in DALYs by cause over the last decade (2008 to 2017) by age and sex, and observed the following:[3]
- Reductions in DALYS amongst neonates over the last decade have very largely comprised reductions in neonatal causes.
- Amongst post-neonatal infants, each of the main causes (neonatal causes, congenital, Sudden Infant Death Syndrome) fell 10-20%, with the only rise being in iron deficiency. In contrast, neonatal causes rose approximately 10% in each age group, likely reflecting the increased burden of neonatal survivorship. This burden was highest amongst 1-4 year olds (where neonatal causes represent 12% of total burden) but is evident through to 20-24 year olds (approximately 2.5-3% of burden).
- Amongst 1-4 year olds, rises were seen in neonatal causes, iron deficiency and mental health causes, with falls in all other causes, with the largest falls in congenital causes.
- For 5-9 year olds, rises were seen in neonatal causes, fall injuries, mental health causes, iron deficiency and diarrhoea, with falls in causes such as skin, asthma, congenital causes and road injuries.
- Similar pattern was seen amongst 10-14 year olds, with additional rises in acne and back pain, whilst burden from asthma, skin, congenital causes and road injuries fell.
- Change was similar across both sexes amongst 15-19 year olds, with rises predominantly in mental health causes and alcohol and drug-use disorders, acne and neonatal causes, with notable falls in burden from road injuries, asthma and self-harm.
- Amongst 20-24 year olds, there were fewer rises than in 15-19 year olds although patterns amongst causes were similar.
Data from the GBD study provide an extra-ordinary resource for tracking burden in the world’s children, however, there are a number of key child health areas which are poorly represented in GBD data. Some new areas are not well covered, for example, allergies. Other areas are left out altogether, e.g. the child protection work which is a large part of many paediatrician’s workload. Obesity is an area of omission for the GBD study, perhaps reflecting the study’s origins in global health.[4] Lastly, some broad areas such as disability are relatively invisible in GBD as burden is segmented into the individual causes. We recognise that each of these areas is a growing part of the work of paediatricians and represent growing burden for children and young people.
Healthcare activity
Healthcare activity is driven by a number of factors, including: health need; population growth and sociodemographic factors; patient expectations and help-seeking behaviour; growth in medical knowledge and capability; and factors within the health system, including increased fragmentation. There are also known factors which are more specific to healthcare activity in paediatrics; for example, in England, limited capacity in primary care and lack of anticipatory prevention have been identified as drivers of increase CYP emergency activity.
Over the past decade, there have been marked increases in hospital use by children and young people across all four UK nations. We looked for healthcare activity data across all four UK nations, and some of the trends we found are summarised below.
Our full methods and data notes can be found in our published paper[5] – what we have presented here is an executive summary.
For ED attendances and admissions, data were obtained from the following sources:
- England: Hospital Episode Statistics (HES)
- Scotland: Information Services Division (ISD)
- Wales: Secure Anonymised Information Linkage (SAIL) databank
- Northern Ireland: Data were sought but were not available
We studied ED attendance rates for England, Scotland and Wales together with the English regions (data shown from 2010) alongside Emergency Admission rates for the same groups from 2001 onwards.
We observed the following trends in ED attendances:
- ED attendance rates increased in each country in each age-group aside from 20-24yo in Scotland.
- ED attendances were higher in England than Scotland or Wales in each age group aside from 10-14yo.
- Increases were linear across the period and most marked in England and in younger age groups.
- Increases amongst infants were of the order of 3.8% (Wales) to 5.1% (England) annually, with increases amongst adolescents around 1-2% annually.
- The South West, South East and East of England having similar ED attendance rates to Scotland and Wales across all age groups, with North East, North West and London having notably higher attendances than other regions and the England average. Increases in activity appeared greatest in these latter 3 regions in all age groups.
We observed the following trends in emergency admissions:
- Emergency admissions similarly increased in each country and age group with the exception of 20-24yo in Scotland.
- In a reverse of the pattern seen for ED attendances, the highest admission rates were seen in Wales in each age group except 20-24yo, whilst Scotland had emergency admission rates similar to England for most age groups except 10-14yo.
- Regional variation in emergency admissions was similar to ED attendances, with the North East and North West having the highest admission rates – with the exception of London, which had amongst the lowest admission rates in each age group despite high ED attendances.
- Differences between age-groups were more marked than for ED attendances, with only minimal change amongst 15-24 year olds but marked increases amongst younger children.
- In Scotland and Wales, proportional increases in Emergency Admissions were similar to those for ED attendances for infants but were notably lower than increases in ED attendances amongst infants in England.
We also looked at the data by deprivation quintile:
- Examination of ED attendances and admission rates by deprivation quintile showed clear social gradients in rates across each country, with attendances and admissions highest in the most deprived quintile for each activity type.
- Elective admissions showed a similar pattern to emergency activity although elective admissions in England showed the smallest social gradients of any country.
- The ratio of the most to least deprived quintile changed little over time for emergency activity.
More detail on the trends observed for England, including graphs and data tables, is available in our separate research paper.[6]
We also looked at causes of emergency admissions across all age groups from 2007-2017 in England. We chose to limit analyses of cause-level data for admissions to England for a number of reasons including data availability with no cost and problems with sample size with rare causes in smaller populations. Additionally, we thought it likely that the same cause-level trends were likely to be seen across each country.
The data and graphs are available in our research paper,[7] but some of the highlights were:
- Injuries were the most common cause of emergency admissions in those over 5 years
- The largest increase in outpatient attendance rates was amongst infants (72% from 2007-2017), with attendances increasing most in the least deprived quintile (144% compared with 58% in the most deprived).
- Ambulatory-care-sensitive-conditions (ACSC) made up 47% of emergency admissions among infants, 66% among 1-4 year olds, 41% of 5-9 year olds and 17-23% of adolescents.
- Elective admissions from most causes declined across the decade in all age groups
There have been efforts to reduce the apparently unstoppable rises in healthcare activity, more recently including greater integration of care across different layers of healthcare and across the health, social care and education sectors. Improved integration of care for children and young people is now a key element of plans to improve outcomes for children and young people in the UK. In our “Data – Future” section, we have highlighted the difference good integration can make to healthcare activity.
For outpatient activity data are only available for England, obtained from Hospital Episode Statistics (HES). Data were examined on numbers of outpatient attendances and attendance rates per 100,000 population by age, deprivation quintile, clinic type (i.e. speciality code) and whether the appointment was attended or not.
The data show large rises in outpatient department (OPD) attendances and attendance averaging 50% over the past decade amongst 0-24 year olds. This rise has been particularly steep in infants (76% rise). There is some suggestion of a slightly fall from 2016 to 2017 numbers. Appointments where families do not attend (DNA) are relatively low, at 12% of total attendances in 2017. But there is a strong social gradient, with DNA nearly twice as frequent in the most deprived (15%) compared with the least deprived (8%) group.
The largest rises in outpatient attendance have been amongst the least-deprived groups, which led by 2017 to a reversal of the expected gradient in attendances amongst infants and older adolescents. For infants, those who most need care (the most deprived) are now least likely to attend outpatient clinics. Neonatology outpatient attendances rose 250% in the decade (infants).
Paediatrician outpatient workload increased by 66% amongst infants, 49% amongst 1-4y, 72% amongst 5-9y, 90% amongst 10-14y and 150% amongst 15-19 year olds across 2007 to 2017. General Paediatric workload increased 30% amongst infants and 17% amongst 15-19 year olds but was stable for other age-groups. By 2017, Community Paediatrics comprised 1% of total infant attendances, 5% for 1-9 year olds, 3% of 14 year olds and 1% for 15-19 year olds. Other sub-specialist Paediatric workload increased by >300% across the decade in all age-groups, with increases most notable in young people (400% increase in 20-14y; 500% increase in 15-19y). Some of these changes may represent coding issues, e.g. changes in coding from general to speciality paediatric codes driven in part by remuneration.
A graph of outpatient trends is available in our separate research paper.[8]
In late 2019, we conducted an informal search of the literature. Our primary aim was to explore the evidence on the use of specialised and primary healthcare services by children and young people in the UK in order to gain a better understanding of healthcare activity outside of that covered in existing national datasets. We ran a search across the Cochrane library and PubMed, looking for studies of children and young people between the ages of zero and 25 years, in the UK only. We were interested in healthcare activity: admissions, episodes, visits and treatment.
We were unable to look at all papers identified. However, members of our working group met to group them into domains of paediatric care. Papers identified were then looked at in detail across four of these domains:
- Child and adolescent mental health
- Emergency care
- Primary care
- Maternity and neonatal care
The findings are summarised in a supporting file.
Paediatric workforce
RCPCH have a history of conducting a paediatric workforce census. More about our census collection methods and reports from the biannual collections are available on the RCPCH website.[9]
In the following section, we have taken data from our workforce census, going back as far as we have comparable data to 2003. This data are UK-wide and help paint a picture of the trends in the paediatric workforce over the last 18 years.
It is important to note that this section should not be viewed in isolation from the healthcare activity data trends we have presented. RCPCH remain very concerned that the demand for paediatric consultants as a result of increased paediatric healthcare activity is not being met by the current workforce supply.
As Figure 4 shows, the number of whole-time-equivalent (WTE) paediatric consultants has risen steadily since 2003. However, drilling into the data shows that whilst consultant paediatrician numbers in England increased 47% between 2007-2017, most of the increase was in specialist rather than general or acute paediatricians.[10] This is especially concerning given the steadily declining trend in the Speciality, Associate Specialist and Staff Grade (SAS) doctor headcount that can also be seen since 2003.
Data note: the adjustment for whole-time-equivalent (WTE) has been achieved by assuming less than full time (LTFT) work 0.7 WTE across the board. This is an assumption based on reporting across a number of census years. In our individual workforce census reports, we have calculated WTE in more detail.
Figure 4. Existing data, consultant and SAS headcount (RCPCH workforce census) adjusted for WTE
Figure 5 reports that less than full-time working trends among paediatric consultants have been stable across the period 2003 to 2017 at around 27.8%.
Figure 5. Existing data, consultant working patterns (RCPCH workforce census).
Figure 6 shows the headcount by paediatric consultant job type as reported in the census since 2009. This shows an increase in the proportion of specialist consultants, and a decrease in the proportion of community consultants in the workforce. The proportion of generalists has remained steady.
Figure 6. Existing data, consultant job type (RCPCH workforce census).
Figure 7 shows a steady increase in the number of paediatric trainees from 2012 to 2019. However, despite this trend, it is important to note that there remains a 11.1% rota vacancy rate on tier 1 (junior) and 14.6% on tier 2 (middle grade). RCPCH estimate that there is a need to recruit approximately 600 doctors into ST1 training posts each year for approximately the next 5 years to meet demand.[11]
Figure 7. Existing data headcount trainees (GMC State of Medical Education and Practise reports[12]).
Figure 8 shows that, in a differing trend to consultants, rates of LTFT working are increasing in paediatric trainees, almost doubling between 2012 and 2019. It is important to note that the apparent growth in trainee numbers shown above in Figure 7 may be mitigated by increasing LTFT working.
Figure 8. Existing data, paediatric trainee working pattern (GMC SOMEP reports).
Voice of children and young people
Children and young people’s voice is at the heart of everything we do at RCPCH. Guided by the United Nations Convention on the Rights of the Child, we support children and young people to have their voices heard in decisions that affect them (Article 12) and work with them to help shape services so they have the best healthcare possible (Article 24).
The RCPCH &Us network brings together children, young people up to the age of 25, their parents/carers and families to work with clinicians, decision makers and each other to educate, collaborate, engage and change to improve health services and child health outcomes.
To support voice across the Paediatrics 2040 project, a mixed methods approach was developed, working with a diverse group of children, young people and parents/carers/advocates across the UK. RCPCH &Us has an established diversity model underpinning its work, ensuring children and young people from a variety of experiences are engaged.
Phase one included a series of consultations asking the question “what knowledge, skills and attitudes do doctors need when working with children and young people”. These sessions were delivered to groups of all ages, as well in 1:1 conversations with hospital patients with over 3000 + ideas shared. More information about Phases Two and Three is shared elsewhere in our dedicated Voice Matters section.
The phase one data raw data was reviewed by a research assistant using thematic analysis, coding and theming all responses, refining with the Paediatrics 2040 Project Manager and Children and Young People’s Engagement Manager. This process resulted in 9 recurring themes being identified.
- Mental health and wellbeing– responses relating to mental health disorders, stress, and emotional wellbeing
- Personalised approach – responses relating to the individual, e.g. ‘ask about me’ and ‘my own history’, personal information, or altering behaviour to meet the needs of the individual
- Communication – responses relating to communication including verbal, body language and listening skills
- Open-minded and non-judgmental – responses relating to being open and aware of different experiences, and not projecting assumptions onto others
- Respectful, kind, supportive and friendly – responses relating to behavioural attitudes of the clinician, such as being supportive, showing empathy, and being kind
- Knowledge of current CYP culture and identity – responses relating to contemporary CYP culture such as education, social media, and language
- Youth-friendly services – responses relating to making clinical environments more appropriate for young people, such as approachability, confidentiality, and keeping the young person engaged through various means e.g. toys, stickers etc.
- Good medical conduct – responses relating to general medical knowledge and practice such as medication or general references to conditions e.g. acne, growing pains or punctuality and professionalism etc., language also relating to general characteristics doctors should have such as being trustworthy, good hygiene, professionalism
- Systemic changes – responses relating to systemic changes such as introducing new ways of delivering care, improving the service e.g. seeing the same doctor, training doctors, UNCRC, linking up to school nurses, transition to adult services etc.
Data was also themed according to context e.g. a response that may have been sorted into systemic change may have been placed into youth-friendly services due to the responses of the previous points.
Figure 9: Summary of responses from children and young people to the question
Raw data was reviewed, and data extracted according to the following variables using the grounded theory approach:
- Population:
- Marginalized experiences
- Long term condition experience
- Future thinking
With key themes explored below.
Epilepsy experiences of children and young people and what they need from their services have already been reviewed by the Epilepsy12 Youth Advocates, published in January 2019.[13]
Long term condition experience
CYP asked for clearer communication regarding their conditions, and for valid information to be easily available to them and in a suitable format. Parents of CYP requested for improved communication between services, to save time and prevent repetition, and praised services that had friendly staff and suitable environments for children. Another theme that emerged was in relation to schools and how services should work together to educate teachers on the long-term conditions of their students, as well as their peers to raise awareness to better the school experience of CYP.
The social experience of having a long-term condition was also discussed, such as the difficulties of socialising with friends, as well as cultural expectations which may impact health behaviours. The price of healthy living and how this affected access to exercise and healthy foods was also raised, as well as the transition from child to adult services which meant services that were previously available for free now had to be paid for.
Marginalized experiences
CYP asked for more personalised approaches to receiving care, such as being asked if they wanted another adult with them and knowing their history and background. Alternative means of communication was also discussed, especially for topics that CYP may have difficulty talking about. Whiteboards and iPads were mentioned and being able to draw or point to a diagram or emojis were suggested means. CYP asked for appropriate language to be used by doctors, such as “easier words” and better explanations. They also asked for doctors to be understanding of their situation, and to have an awareness that the young person might not always be happy. The environment was also mentioned, with a preference for bright colours and toys available for younger children.
Future Thinking (What would revolutionise care in 2040?)
A key theme that emerged was investing more into health, CYP asked that more be given to the NHS and research to develop cures and improve services so that everyone can access healthcare. Addressing health inequalities was also raised, such as ensuring access to treatments and equal opportunities for all, as well making unhealthy foods less accessible. Improving technology was also discussed, as well as increasing the number of healthcare practitioners such as nurses, doctors, and orthodontists. CYP answered that more flexibility would revolutionise care, this included moving care into schools and increasing the number of nurses in schools, being able to have online appointments, and being more flexible with the timing.
References
Steel N, Ford JA, Newton JN, et al. Changes in health in the countries of the UK and 150 English Local Authority areas 1990-2016: a systematic analysis for the Global Burden of Disease Study 2016. Lancet 2018; 392(10158): 1647-61.
Ward J, Hargreaves D, Turner S, Viner R, Royal College of Paediatrics and Child Health Paediatrics 2040 Data Working Group. Change in burden of disease in UK children and young people (0-24 years) over the past 20 years and estimation of potential burden in 2040: analysis using Global Burden of Disease (GBD) data. medRxiv 2021.02.20.21252130; https://doi.org/10.1101/2021.02.20.21252130 [Figure 2 and Appendix Figure 1]
Ward J, Hargreaves D, Turner S, Viner R, Royal College of Paediatrics and Child Health Paediatrics 2040 Data Working Group. Change in burden of disease in UK children and young people (0-24 years) over the past 20 years and estimation of potential burden in 2040: analysis using Global Burden of Disease (GBD) data. medRxiv 2021.02.20.21252130; https://doi.org/10.1101/2021.02.20.21252130 [Figure 3 / Appendix Table A4]
There is lots more on the burden of obesity in our RCPCH State of Child Health 2020 and Child Health 2030 reports
Ward J, Hargreaves D, Rogers M, Firth A, Turner S, Viner R. Recent and forecast post-COVID trends in hospital activity in England amongst 0 to 24 year olds: analyses using routine hospital administrative data.
Ward J, Hargreaves D, Rogers M, Firth A, Turner S, Viner R. Recent and forecast post-COVID trends in hospital activity in England amongst 0 to 24 year olds: analyses using routine hospital administrative data.
Ward J, Hargreaves D, Rogers M, Firth A, Turner S, Viner R. Recent and forecast post-COVID trends in hospital activity in England amongst 0 to 24 year olds: analyses using routine hospital administrative data.
Ward J, Hargreaves D, Rogers M, Firth A, Turner S, Viner R. Recent and forecast post-COVID trends in hospital activity in England amongst 0 to 24 year olds: analyses using routine hospital administrative data.
RCPCH. About our workforce census. https://www.rcpch.ac.uk/work-we-do/workforce-service-design/about-workforce-census
Workforce census: UK overview report (2019). London: Royal College of Paediatrics and Child Health, 2019. https://www.rcpch.ac.uk/resources/workforce-census-uk-overview-report-2019
RCPCH. 2017 workforce census overview (2019). https://www.rcpch.ac.uk/sites/default/files/2019-11/soch_workforce_census_overview_2019_-_v4_30.10.19.pdf
General Medical Council. The state of medical education and practice in the UK. (various years) https://www.gmc-uk.org/about/what-we-do-and-why/data-and-research/the-state-of-medical-education-and-practice-in-the-uk
RCPCH. Epilepsy12 &Us – voices from the RCPCH &Us network. https://www.rcpch.ac.uk/resources/epilepsy12-us-voices-rcpch-us-network